
Track affiliate results
See clicks, trials, sales, and earnings for each affiliate campaign in the Partner app. Find every report and learn which UTMs to add to your links.
 Sylwia KocurUpdated 4 min read
The Partner app lets you track your affiliate campaign results in real time, from clicks and trials to sales and earnings. Use these reports to find the campaigns that work and fix the ones that don’t. For the most detailed data, build custom campaigns with the campaign builder.
What is affiliate performance?
Affiliate performance is the overall result of your affiliate campaigns, measured in clicks, trials, and sales and tracked in the Partner app. It allows you to see which campaigns bring you value and which need optimizing, so you can repeat your winning strategies in future campaigns.
Click: Each click in your affiliate link.
Trial: A product trial that was started by a user that was brought by your link.
Sale: A purchase made by a user that was brought by your link.
Why do custom campaigns give you better reports?
Your default affiliate link allows you to grab a link and share it on your pages in almost no time. Its downside is that it doesn’t provide your audience with any extras: like a longer trial period or a discount for a good start. For all data gathered for this link you will get a bulk report.
Here are the benefits of using the campaign builder:
You can customize your offer by adding the trial length and a discount.
You can choose the landing page you want your audience to visit first (and customize your copy).
You can create a name for your campaign and monitor its performance within in-app reports.
You’ll get a separate report for every campaign.
If you share your default affiliate link, all its clicks, trials, and sales are stored under the name “default.” You won’t be able to learn which channel or which copy was the most successful.
However, if you create two custom campaigns, one for Facebook and one for X, you can give them separate names, and see which channel works best for you.
Where can you find your results in the Partner app?
You can monitor your performance in three places: the dashboard, the page of each campaign, and the total performance view.
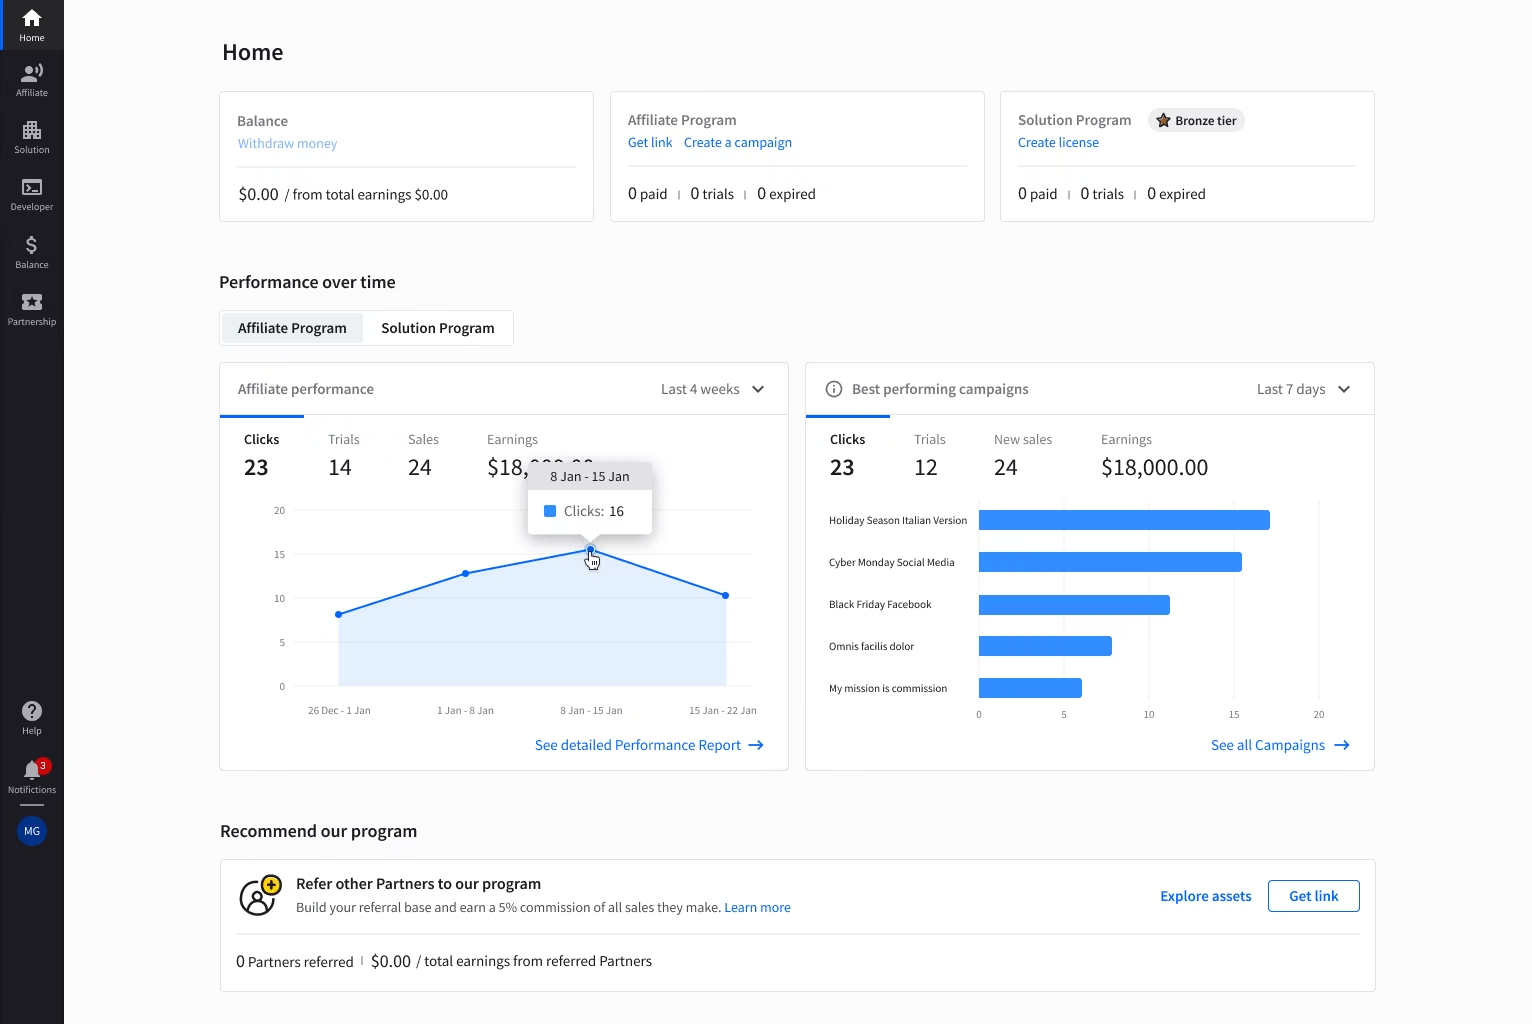
Dashboard: performance over time
When you log in, the first report you see is performance over time. Here you can see your clicks, trials, sales, and total earnings. You can select different time frames and switch between charts.
Individual campaigns: detailed insights
Open a campaign’s page to dig deeper into its data:
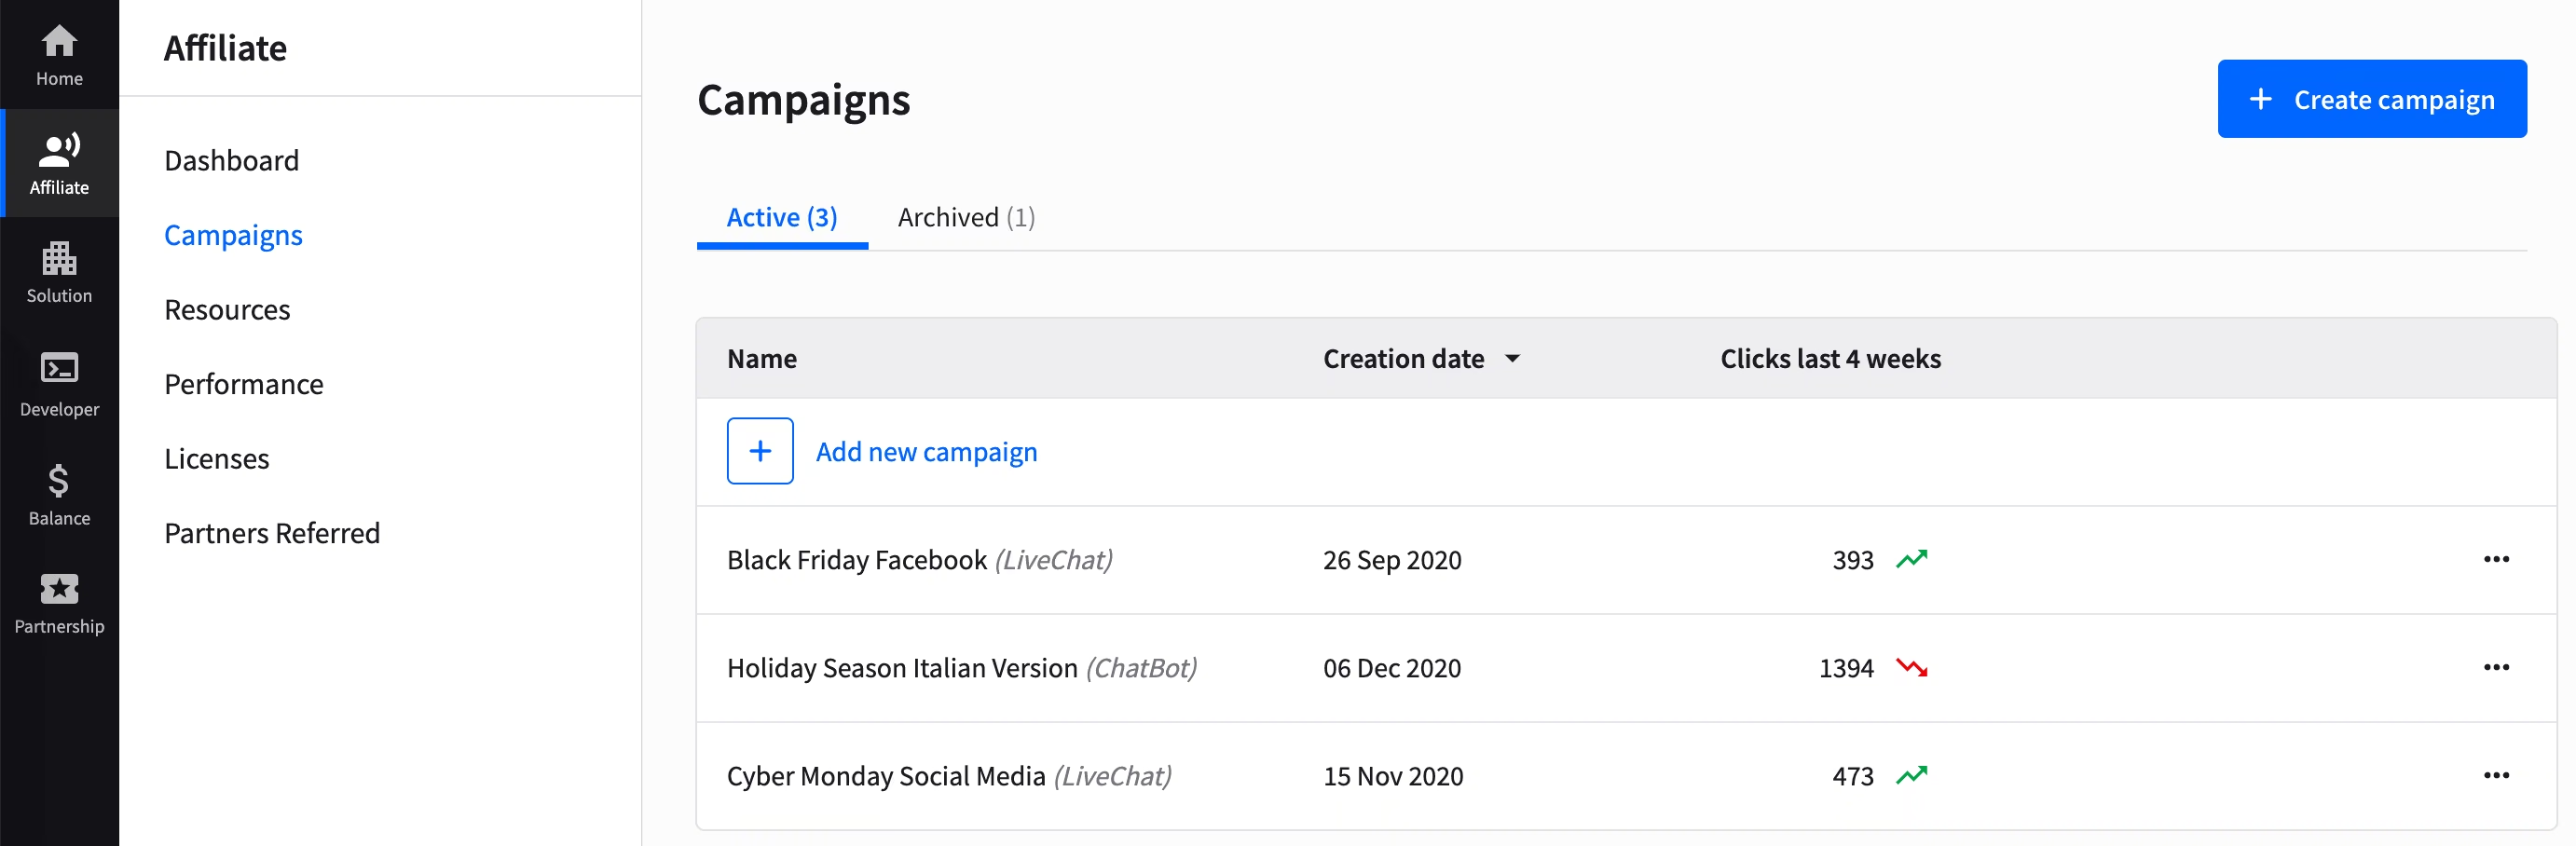
Go to Affiliate > Campaigns.
Select a campaign from the clickable list of campaigns created with the campaign builder.
Open the Overview, Sharing options, or Performance tab.
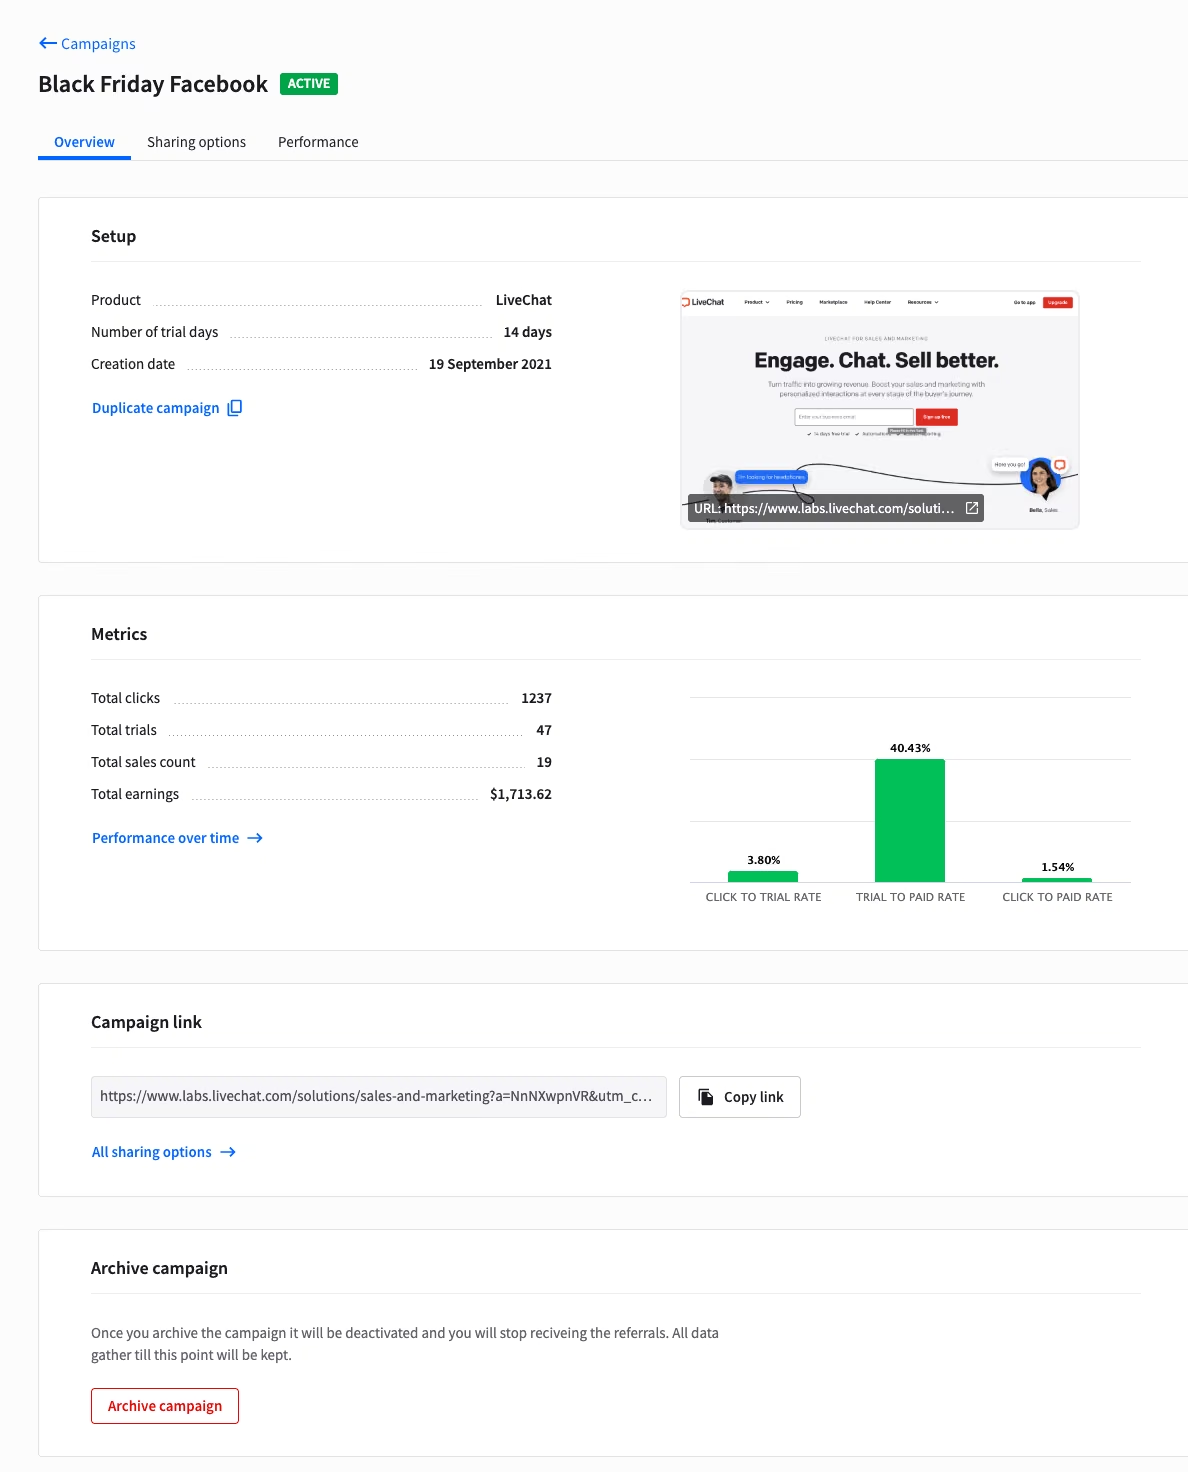
Overview: This section lets you quickly check the campaign details, the most important metrics, and the campaign link. You can also archive it if you wish.
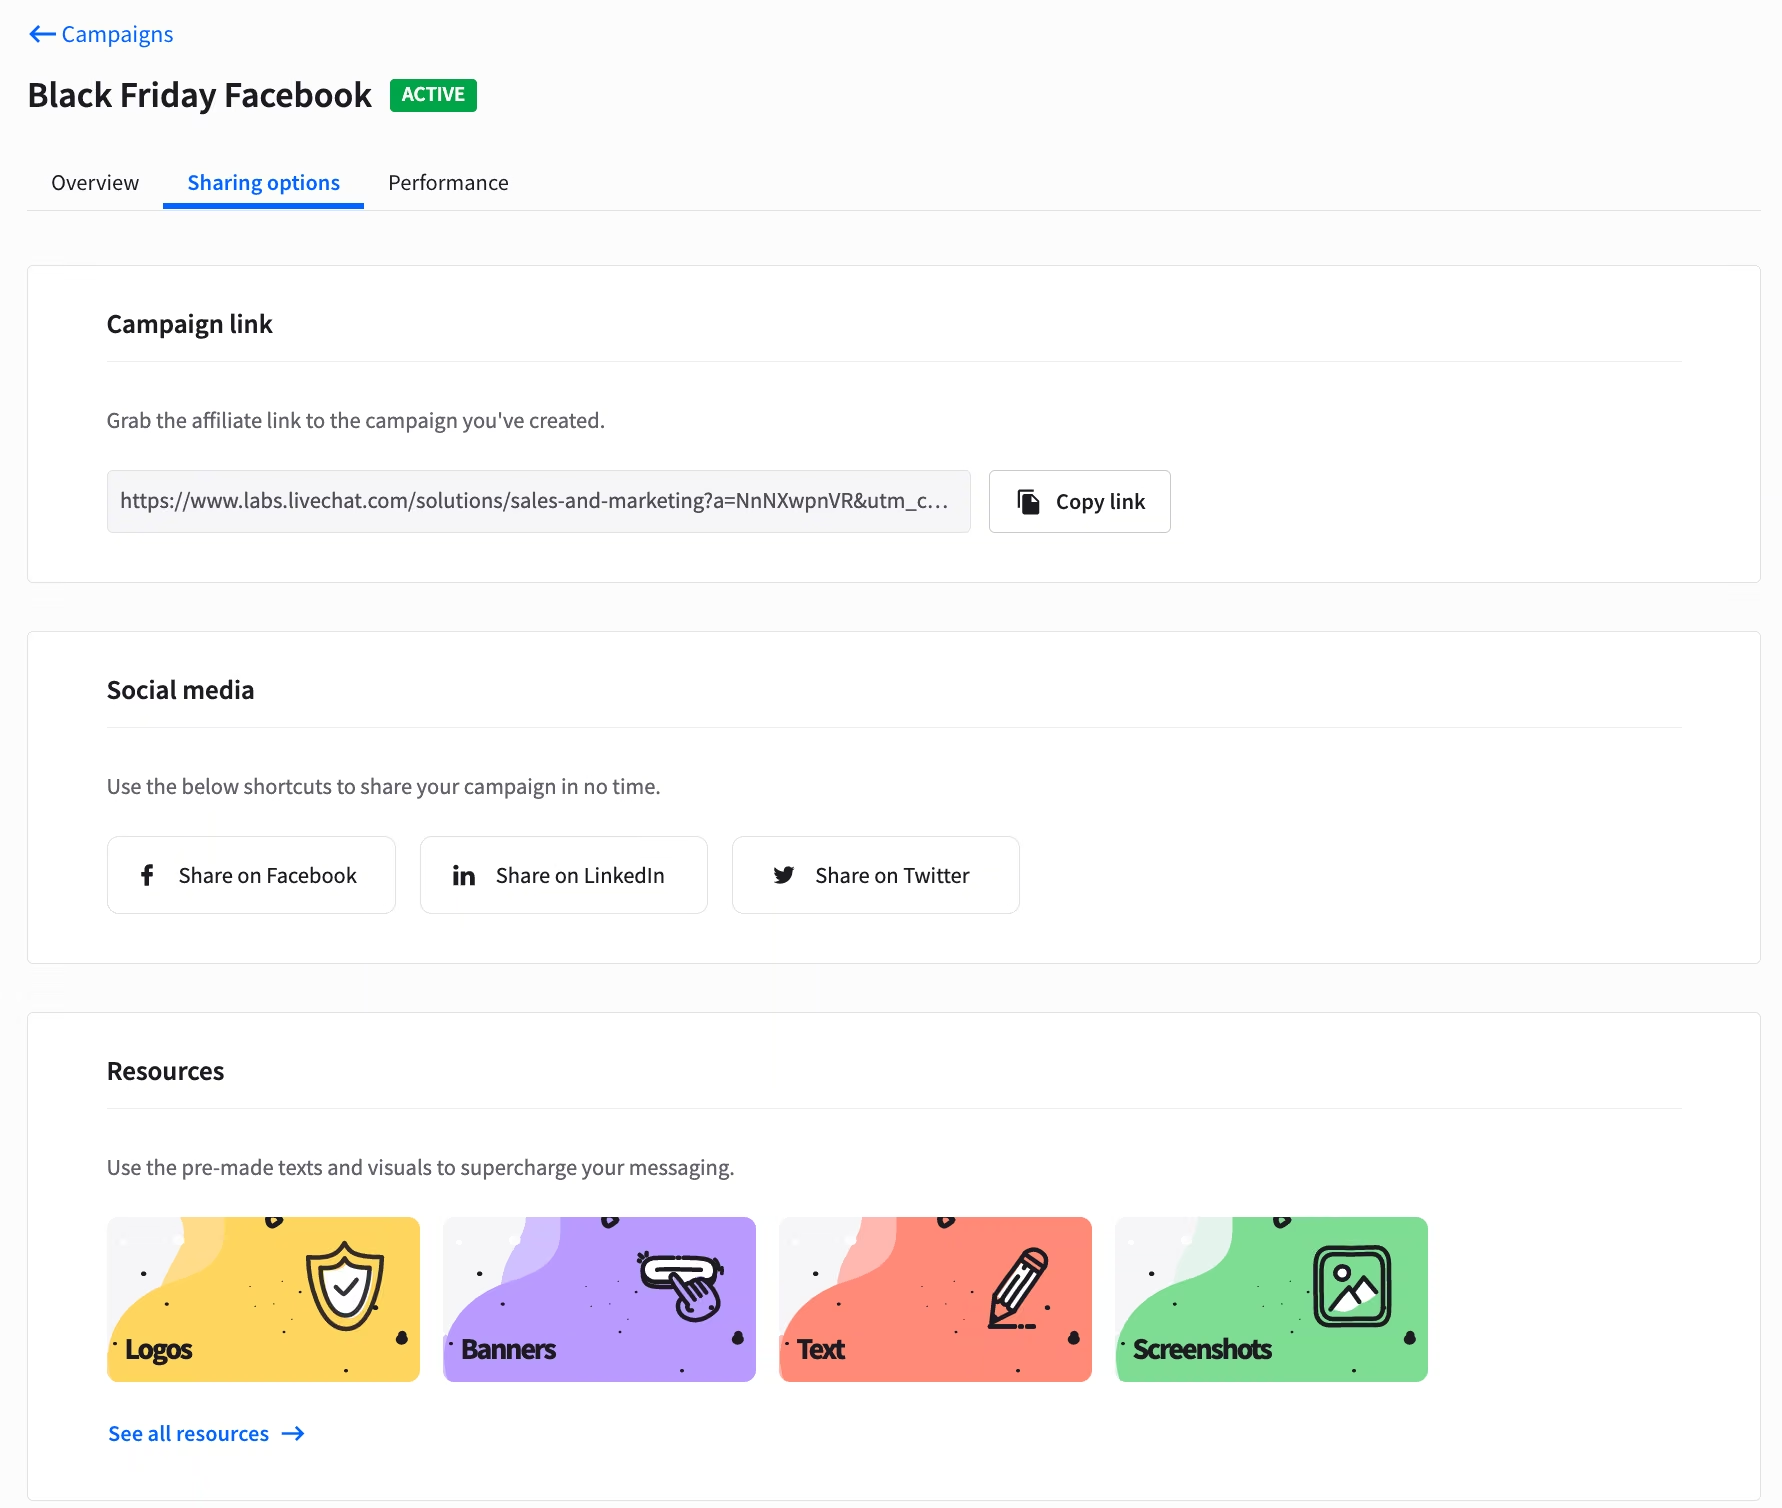
Sharing options: It’s the place where you can quickly copy the campaign link and share the campaign on social media. You can also quickly review the additional resources you might want to use when promoting your campaign.
Performance: This tab has four views.
Aggregated data: By choosing time filters, you can see how many clicks your campaign generated and how many new trials it brought (how valuable the traffic was). It also allows you to spot when your campaign was the most effective.
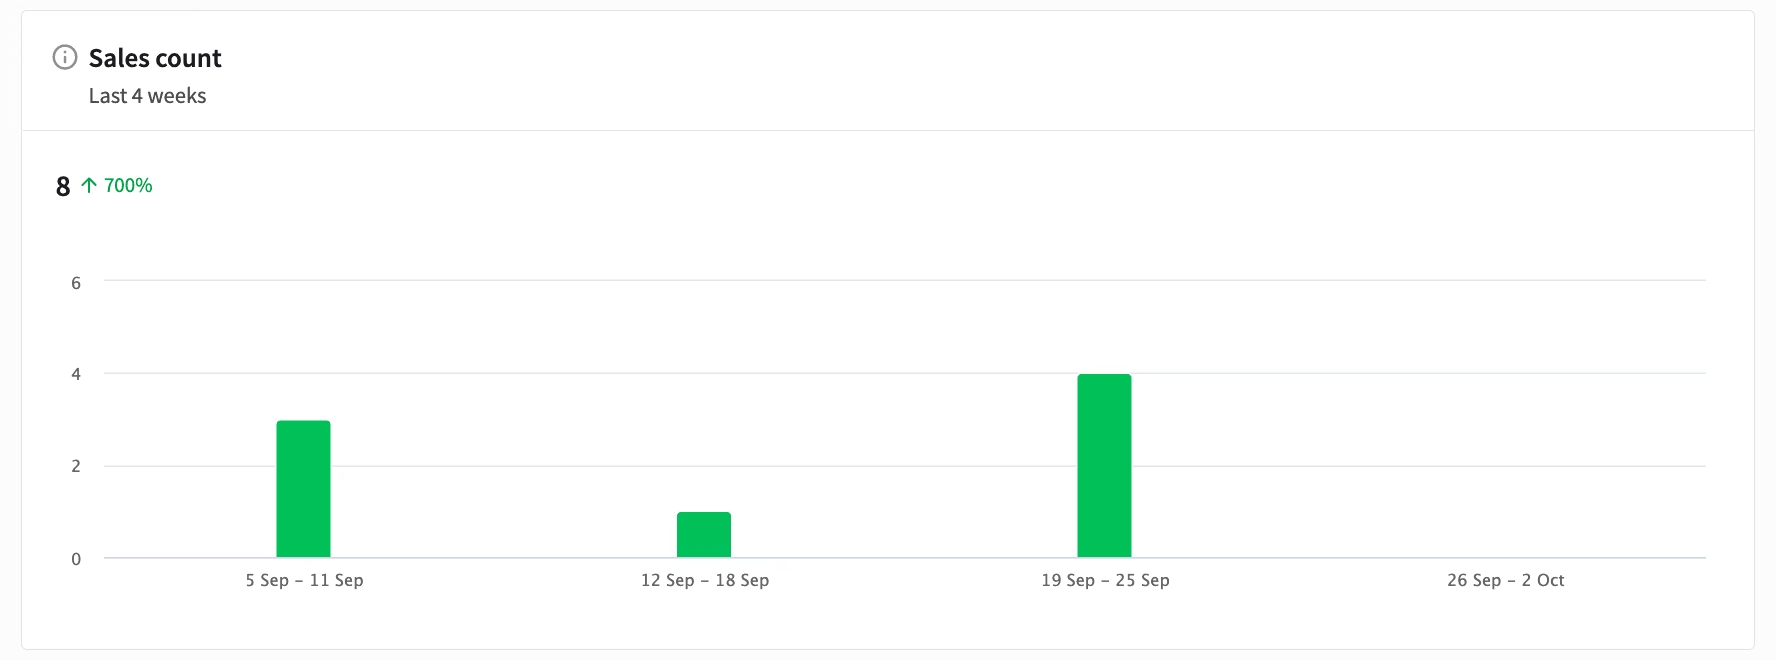
Sales count: This chart shows how many sales your campaign generated.
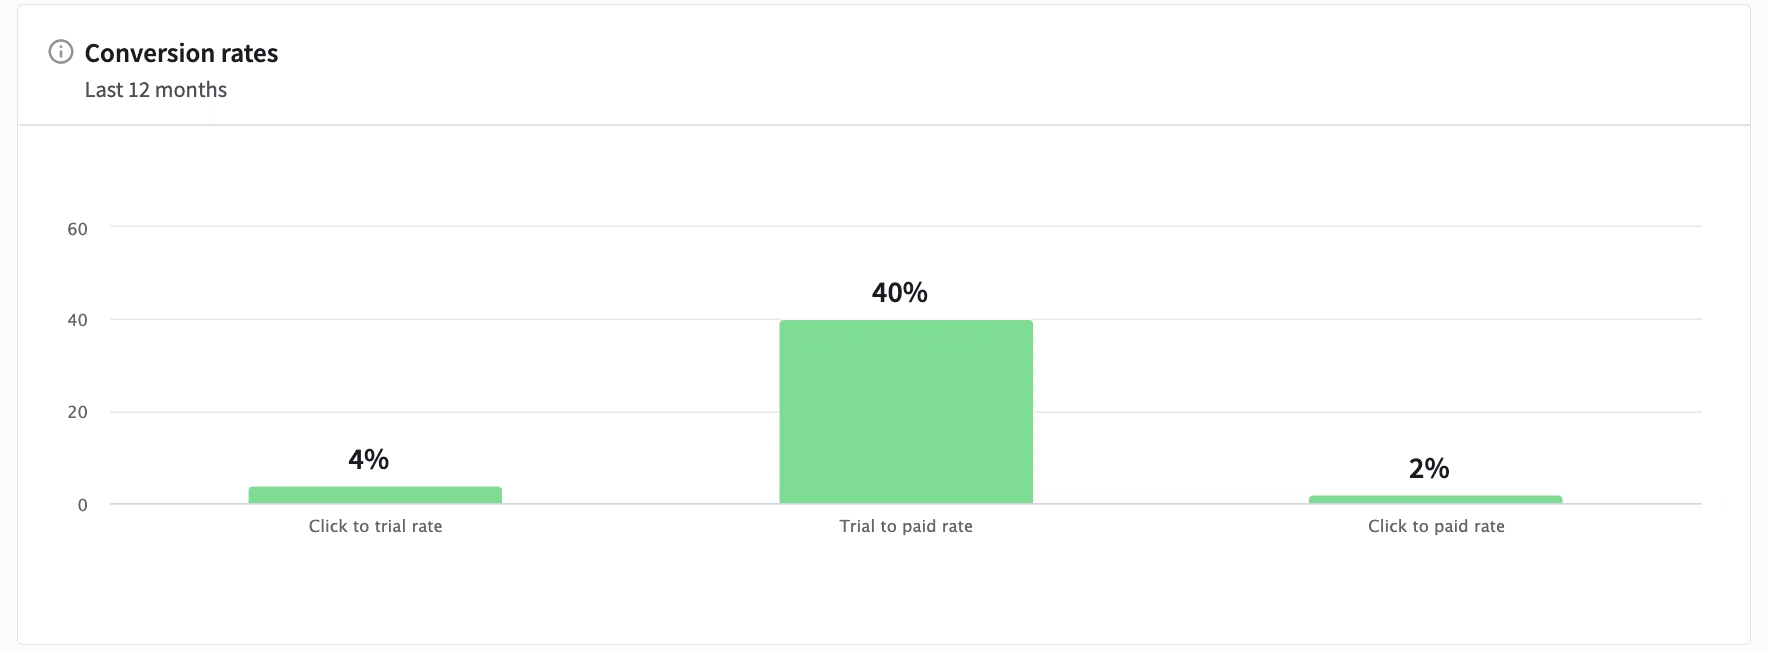
Conversion rates: It indicates how efficient your campaign is in terms of bringing valuable traffic and whether this efficiency changes over time. This chart is available only when you choose the 12 months filter.
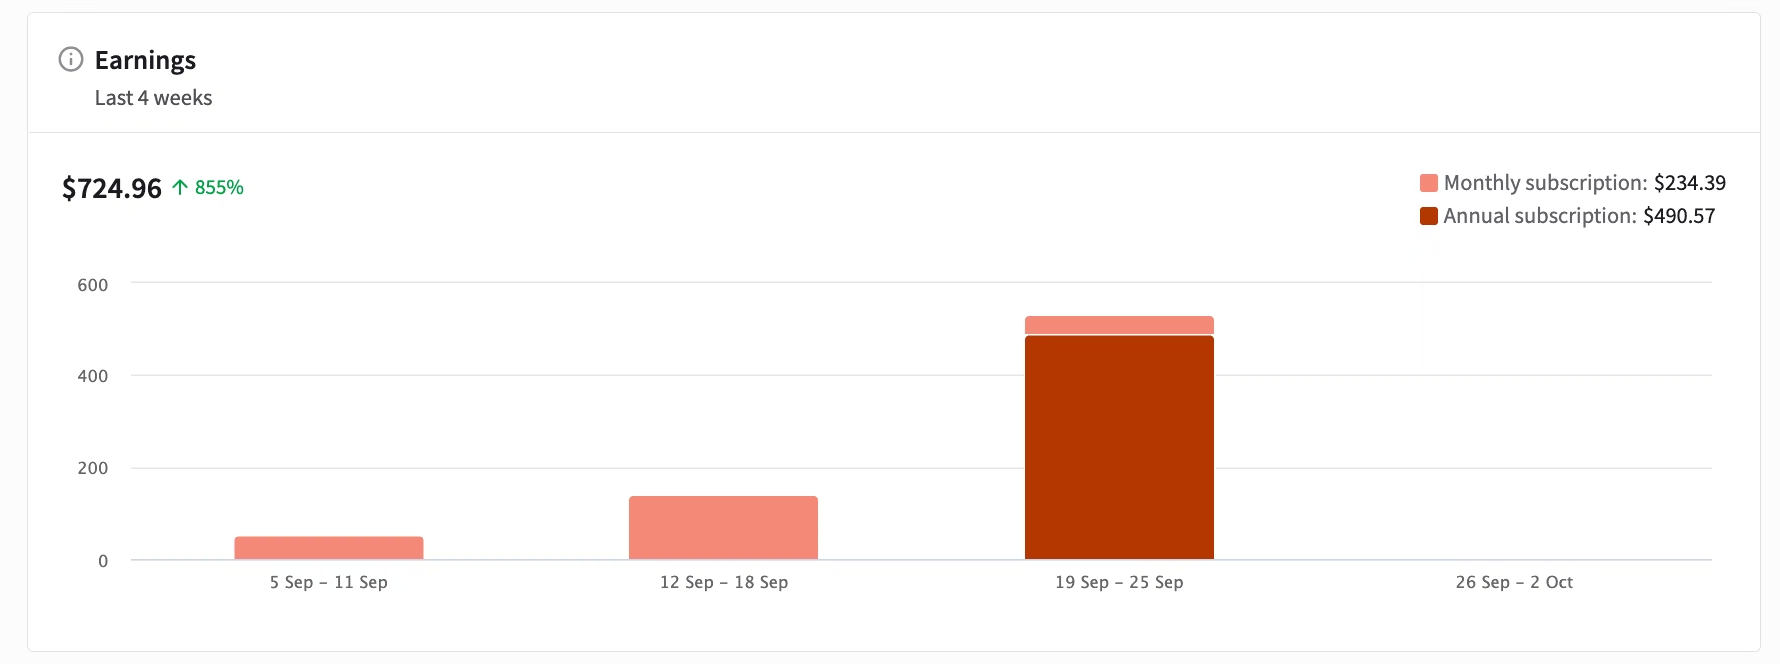
Earnings: It shows the campaign’s income and whether it changed over time. The total amount includes new conversions and recurring payouts from previously brought customers. Learn more about how commissions work in the Text Affiliate Program
All campaigns: total performance
For a quick look at all your campaigns, go to Affiliate > Performance. The table shows:
Campaign name
Product
Clicks
Trials
QLs (Qualified Leads - the number of licenses that actually installed our product on their website and tested it)
Paid accounts (how many licenses purchased our products)
Partners referred (how many partners you brought with a particular campaign)
Earnings
Which UTM parameters can you add to your affiliate link?
If you’d like to know more about your audience behavior, you can add your own UTMs to your link and download your customized UTM-based report. You can use these parameters:
utm_medium - see what channel brought you the most traffic. It can be an ad, email, blog post, or social media channel.
utm_content - this is great if you’re using a few different ads or newsletter versions. By tracking it, you can tell which piece of content outperformed others.
utm_term - this represents the keywords you tag your campaign with. It can be anything you find important, e.g., third-party tracking software’s custom parameters.
Once your links are customized and the campaigns are up and running, you can check their performance by downloading the CSV report in the Affiliate > Performance section.